
Quick Answer: Annual Electricity Generation
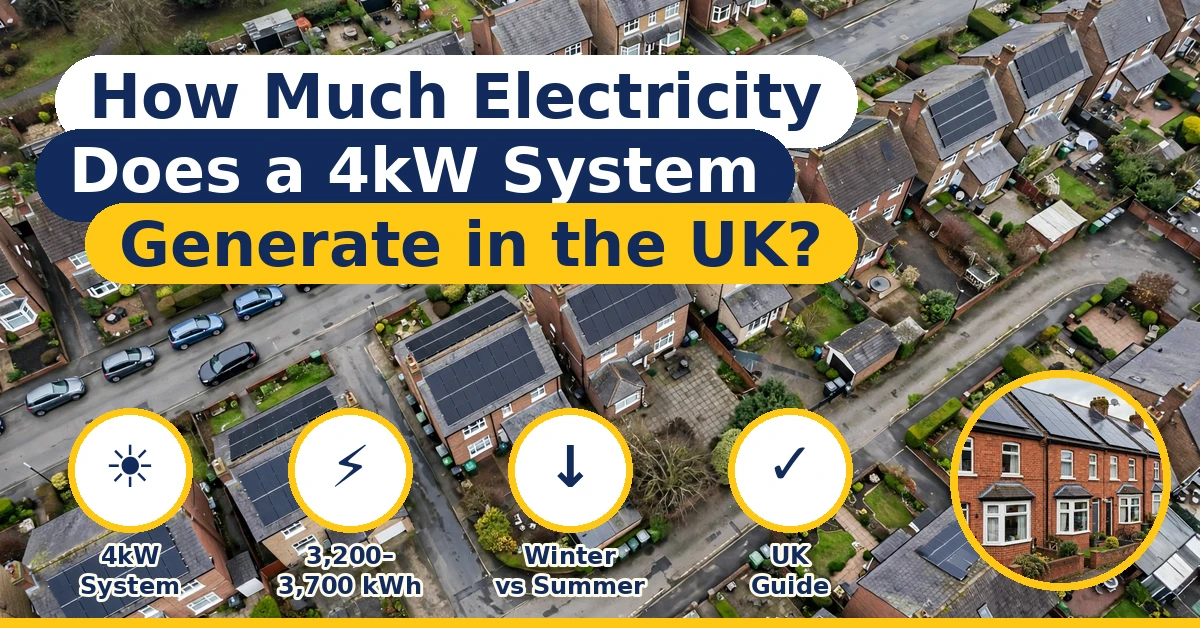
A typical 4kW solar panel system in the UK can generate around 3,200 to 3,700 kilowatt-hours (kWh) of electricity per year under reasonably favourable installation conditions. Some well-positioned systems in sunnier parts of southern England can generate more than 4,000 kWh annually, while installations farther north or on less favourable roofs may produce considerably less. These figures are estimates, not guarantees: the exact result depends on the local solar resource, roof orientation, panel angle, shading, equipment, and system losses. A recent UK location model based on the European Commission’s PVGIS data gives examples of roughly 2,768 kWh per year in Lerwick and 4,168 kWh in Brighton for a 4kWp system on a 35-degree south-facing roof. That is a useful illustration of how much location can matter. Source: UK regional generation model.
The easiest way to understand the estimate is to think in terms of annual energy rather than the system’s headline power rating. A 4kW system does not produce 4kW continuously from sunrise to sunset. Its output rises and falls with daylight, cloud cover, panel temperature, and the position of the sun. On a bright summer afternoon, the system may approach its rated output for a period, but early mornings, evenings, cloudy weather, and winter days produce much less. Across a full year, all those high and low periods combine to create the annual kWh total.
For a homeowner, the annual figure is a useful starting point, but it does not tell the whole story. You also need to know when the electricity is generated and how much your household can use at that moment. A home that runs appliances during sunny hours may use more of its solar electricity directly. A household that is empty through the day may export a larger share to the grid unless it uses a battery or shifts activities to daylight hours. The best estimate therefore considers both generation and the household’s pattern of electricity use.
What Does 4kW or 4kWp Actually Mean?
When installers describe a system as 4kW, they usually mean a solar array with a rated peak capacity of approximately 4 kilowatts peak (4kWp). The kWp rating describes the maximum DC power the panels are designed to produce under standard test conditions. It is a capacity measurement, not the amount of electricity generated over a day, month, or year. Think of it like the engine rating of a car: it tells you something about its potential performance, but it does not tell you how far the car will travel on a particular journey.
Electricity generation is measured in kilowatt-hours. One kilowatt-hour is the energy used by a 1kW appliance running for one hour. If a solar system produces 2kWh during a particular period, that is the amount of energy generated during that time, regardless of whether it was produced steadily or in short bursts. This distinction is important when comparing installer estimates, electricity bills, and monitoring-app figures. A display showing 3.5kW is reporting an instantaneous power level, while a daily total of 12kWh reports accumulated energy.
A 4kWp array might use around 9 to 11 modern panels, depending on the wattage of the modules selected. For example, ten 400W panels add up to 4,000W, or 4kWp. The actual number of panels can vary because manufacturers offer different module sizes and power ratings. The roof area required also depends on panel dimensions, roof layout, access requirements, and spacing. Always check the quoted panel capacity rather than relying only on the number of modules.
Average Daily, Monthly, and Annual Solar Output
A yearly estimate is useful for understanding the overall value of a solar installation, but daily and monthly figures make the system easier to picture. If a 4kW system generates 3,500kWh over a year, dividing that total by 365 gives an average of about 9.6kWh per day. That does not mean it will generate 9.6kWh every day. A clear summer day may produce several times that amount, while a short, overcast winter day may deliver only a small fraction of the daily average.
Monthly output is similarly uneven. In the UK, solar generation is strongly seasonal because daylight hours and solar elevation change throughout the year. Late spring and summer generally provide the highest production, while November, December, and January are usually the weakest months. A household should therefore avoid judging a system’s performance from one winter afternoon or expecting the same daily yield in January as in June. Looking at a full month or a complete year gives a much fairer assessment.
The figures below are illustrative planning estimates for a reasonably positioned 4kWp UK system producing around 3,500kWh annually. They are not a guaranteed national monthly profile. A real system’s monthly split will vary by postcode, roof direction, tilt, weather, and shading. Use a location-specific PVGIS or MCS-based estimate when making a financial decision.
Estimated Monthly Generation in the UK
| Month | Illustrative generation | Approximate daily average |
|---|---|---|
| January | 90 kWh | 2.9 kWh |
| February | 150 kWh | 5.4 kWh |
| March | 280 kWh | 9.0 kWh |
| April | 390 kWh | 13.0 kWh |
| May | 450 kWh | 14.5 kWh |
| June | 470 kWh | 15.7 kWh |
| July | 450 kWh | 14.5 kWh |
| August | 390 kWh | 12.6 kWh |
| September | 270 kWh | 9.0 kWh |
| October | 190 kWh | 6.1 kWh |
| November | 120 kWh | 4.0 kWh |
| December | 80 kWh | 2.6 kWh |
| Total | 3,340 kWh | 9.2 kWh annual daily average |
This sample profile totals approximately 3,340kWh, which sits within the broad range that many UK homeowners might use for an initial estimate. It is deliberately illustrative: actual monthly results can move substantially from one year to another. For example, a bright April can outperform a dull May, and a clear winter spell can produce more than a heavily overcast period in early autumn. Monitoring your own system over time is the best way to establish its normal seasonal pattern.
Why Summer and Winter Output Are So Different
The biggest reason for the seasonal gap is the amount of usable sunlight reaching the panels. In summer, the UK has longer days and the sun travels higher across the sky. Panels can receive useful sunlight for many more hours, and the system has a greater opportunity to generate electricity. In winter, daylight is shorter, the sun remains lower, and weather conditions are often cloudier. Even if a solar array is working perfectly, these natural changes reduce its energy production.
Winter performance is not necessarily a sign of a faulty installation. A 4kW system that produces only a few kilowatt-hours on a dull December day may be operating normally. Snow, persistent cloud, heavy rain, and nearby shading can reduce output further, although rain can sometimes help wash away surface dust. Summer brings longer generation windows, but very high panel temperatures can reduce module efficiency slightly. Solar panels do not need scorching air temperatures to work well; bright, cool conditions can be favourable.
This seasonal pattern matters when planning household energy use. Solar panels are unlikely to meet all a typical home’s electricity needs in every winter month without support from the grid or another energy source. They can, however, make a substantial contribution over the year, particularly when paired with sensible daytime usage and, where appropriate, battery storage. A battery can move some daytime solar energy into the evening, but it cannot create extra electricity or solve a long period of low winter generation.
How Location Affects 4kW Solar Generation
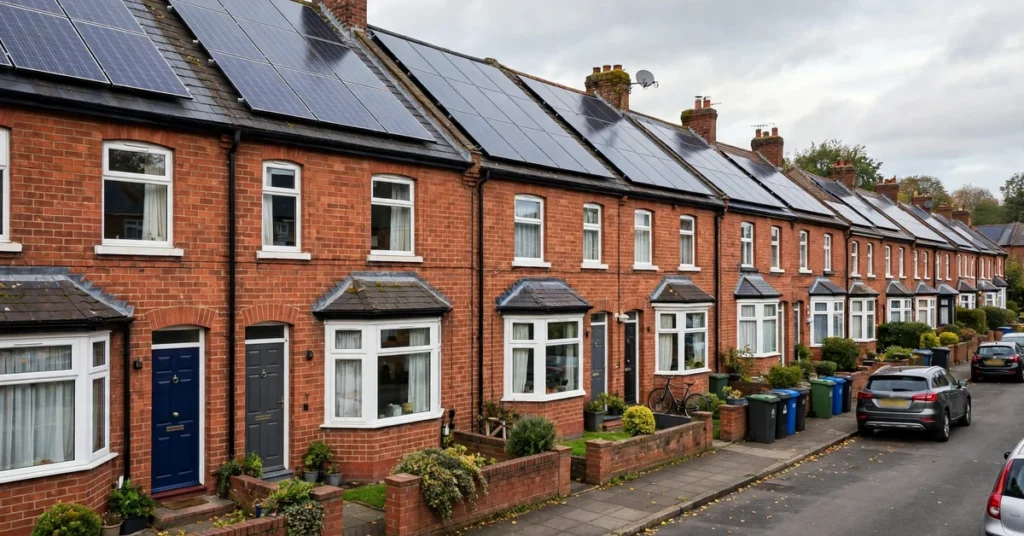
The amount of sunshine available varies across the UK. Southern areas generally receive more annual solar irradiation than northern areas, although local weather, coastal conditions, altitude, and the precise site can affect the result. A 4kW array in southern England may therefore generate more electricity than an otherwise identical system in northern Scotland. The difference is real, but it does not mean solar panels are unsuitable for northern homes. Solar PV works with daylight, including diffuse light on cloudy days, rather than needing uninterrupted direct sunshine.
A recent location-by-location model using PVGIS 5.3 data and a 20% system-loss assumption provides a useful comparison. For a 35-degree south-facing roof, it estimates annual output of 4,168kWh for Brighton, 3,676kWh for London, 3,496kWh for Birmingham, 3,204kWh for Manchester, 3,084kWh for Glasgow, and 2,768kWh for Lerwick. These figures are modelled examples, not measured guarantees for every property in those places. Roof direction, shade, and the exact postcode can change an individual result. Source: solar.org.uk regional PVGIS model.
Southern England Compared with Northern Scotland
| Example location | Modelled annual output for 4kWp |
|---|---|
| Brighton | 4,168 kWh |
| Plymouth | 4,048 kWh |
| London | 3,676 kWh |
| Birmingham | 3,496 kWh |
| Manchester | 3,204 kWh |
| Glasgow | 3,084 kWh |
| Inverness | 2,936 kWh |
| Lerwick | 2,768 kWh |
The table shows a broad north-south pattern, but it should not be used as a postcode-level quote. Two houses in the same city can have different generation because one roof faces south without shade while the other faces east or is partly blocked by trees. A home in the north with a clear, well-oriented roof may outperform a poorly positioned installation farther south. The roof itself can matter almost as much as the regional solar resource.
If you are comparing quotes, ask each installer to state the estimated annual generation in kWh and explain the assumptions behind it. A good estimate should identify the system capacity, location, roof orientation, tilt, shading, and assumed losses. It should also make clear whether the figure is a first-year estimate or a long-term average. Avoid relying on a single national average when you can obtain a calculation based on your actual roof.
Roof Direction, Tilt, and Shading
The direction your panels face has a significant effect on how much sunlight they receive over the year. In the UK, a roof facing south is often used as the reference case because it generally captures strong sunlight across the day. However, east- and west-facing roofs can still be productive. East-facing panels tend to generate more in the morning, while west-facing panels produce more later in the afternoon. Depending on when a household uses electricity, that spread can be useful even if the total annual generation is lower than a comparable south-facing array.
Panel tilt also affects the angle at which sunlight reaches the modules. A moderately pitched roof often provides a practical balance for annual generation, but there is no single perfect angle for every UK property. Flat roofs may use mounting frames to set a suitable angle, subject to planning, wind loading, roof structure, and installer design. A roof that is too steep or too shallow can still work; the impact depends on its orientation and local conditions.
Shading deserves particular attention because it can reduce output more than homeowners expect. A chimney, tree, neighbouring building, aerial, or dormer can cast shadows over part of an array. Depending on the panel layout and inverter or optimiser design, shade on one module may affect the output of a larger group of panels. Installers should assess shade throughout the year rather than checking only whether the roof is sunny during the site visit. If trees grow or nearby buildings change, the system’s performance can also change over time.
South-Facing vs East- and West-Facing Panels
For a 35-degree roof, the same UK regional PVGIS model estimates that east- or west-facing systems can generate less annual energy than south-facing systems. In the example dataset, Brighton’s 4kWp south-facing estimate is 4,168kWh, compared with 3,288kWh for an east- or west-facing roof. London’s comparable examples are 3,676kWh south-facing and 2,856kWh east- or west-facing. These are modelled examples and should not be treated as a universal percentage for every roof. Source: roof orientation and pitch model.
A split east-west array can be a practical option when a property does not have enough suitable south-facing roof space. It may spread generation more evenly between morning and afternoon, which can help match household demand. For example, a family that uses appliances early in the morning and again after work may value a broader generation curve. The best design is not always the one with the highest theoretical annual kWh; it is the one that works well with the roof, budget, grid connection, and electricity-use pattern.
What Affects the Real Output of a 4kW System?
Several factors influence the electricity a 4kW solar system actually generates. The first is sunlight, including the number of daylight hours and the strength of solar radiation. The second is the physical installation: panel direction, tilt, ventilation, wiring, and shading. The third is the equipment, including panel efficiency, inverter performance, system design, and any power limits. Finally, the system’s condition and maintenance can affect output over its lifetime.
Panel temperature is sometimes misunderstood. Solar modules need light, not heat, and their electrical performance can decline as cell temperature rises above the conditions used for their rated output. A cool, bright day can therefore be excellent for generation. Dirt, bird droppings, leaves, and other deposits can block light, especially when they build up over time or cover a meaningful part of a panel. Rain may clean some dust away, but it should not be relied upon to remove stubborn deposits or debris.
Inverter clipping and system design can also influence the numbers. The panels’ combined DC capacity may be higher than the inverter’s AC rating, so the inverter can limit output during periods when the array could otherwise produce more. This is sometimes an intentional design choice, but the installer should explain the system’s expected performance. Cable losses, inverter conversion losses, export limits, and equipment temperature can also affect what reaches the home’s AC circuits or the grid.
A useful way to judge performance is to compare actual generation with the installer estimate over a suitable period. Avoid comparing a single cloudy day with a sunny-day prediction. Look at monthly and annual kWh, and consider whether the weather was unusually poor or good. If output is consistently far below the expected level in comparable conditions, ask the installer to review the monitoring data and check for shading, faults, inverter alerts, or wiring problems.
How Much of the Electricity Can You Use at Home?
Solar generation and household savings are not the same thing. A 4kW system might generate 3,500kWh in a year, but the amount that directly reduces electricity imported from the grid depends on when the home uses power. If the panels generate most of their electricity around midday and the household uses most of its energy in the evening, some generation may be exported rather than consumed on site. The exported electricity may earn a payment under an eligible export arrangement, but the export rate and terms depend on the supplier and tariff.
Self-consumption is the share of solar electricity used in the home rather than exported. Households can often increase it by running suitable appliances during daylight hours. Washing machines, dishwashers, immersion heaters, and EV charging can sometimes be scheduled to make better use of solar generation, provided the appliance and installation are used safely and efficiently. Smart controls can help automate this, although the potential benefit depends on the household’s routine and the equipment involved.
A home battery stores some surplus daytime electricity for later use. It can increase the proportion of solar generation used on site, particularly in the evening, but it adds upfront cost and has round-trip energy losses. Battery capacity should be matched to the household’s consumption pattern and the amount of surplus solar electricity available. A very large battery may not fill regularly in winter, while a small battery may fill early on sunny days and leave further surplus to export.
When comparing financial estimates, ask the installer to separate solar generation, direct self-consumption, battery charging, grid export, and grid import. This makes the assumptions easier to understand. It also prevents a common mistake: assuming every kWh generated by the panels automatically replaces a kWh that would otherwise have been bought from the supplier. The value of a generated unit depends on whether it is used at home or exported, and on the applicable import and export rates.
Can a 4kW Solar System Cover a Typical UK Home?
A 4kW system can make a meaningful contribution to a home’s electricity needs, but whether it covers most or all consumption depends on the household. A smaller, energy-efficient home with modest daytime use may be able to meet a substantial share of its annual electricity demand. A larger property with electric heating, frequent EV charging, a heat pump, or high appliance use may consume much more electricity than the array generates. Even when annual generation and annual consumption appear similar, the timing of generation and demand means the home may still import electricity at night and during winter.
For a simple comparison, imagine a household that uses 3,500kWh of electricity per year and a 4kW array that also generates 3,500kWh. It might seem that the panels cover the home’s entire annual use. In practice, the household will not use all generated electricity at the exact moment it is produced. Some will be exported during sunny periods, while electricity will be imported when the panels are not producing enough. A battery and flexible appliance scheduling can reduce that mismatch, but they do not remove it completely.
It is also important to distinguish electricity from total household energy. Many UK homes use gas for central heating and hot water, so their electricity bill may represent only part of their energy consumption. Solar PV generates electricity; it does not directly replace gas unless the home has suitable electric heating or other equipment that uses the generated power. If you are considering a heat pump or an electric vehicle, assess the likely additional electricity demand before deciding whether 4kW is the right array size.
The best system size is based on roof suitability, current and expected electricity use, budget, export arrangements, and future plans. A 4kW array is a common domestic size, but it is not automatically the ideal option for every home. Ask for a design that explains expected annual generation and how it aligns with your actual consumption profile.
How to Estimate Your Own Solar Generation
You can make a first estimate by multiplying the installed capacity in kWp by the expected annual yield for your location and roof. The yield is expressed in kWh per kWp per year. For example, if a suitable roof has an estimated yield of 900kWh per kWp annually, a 4kWp system would generate approximately 3,600kWh per year before any additional site-specific adjustment not already included in that yield figure. Be careful not to apply a second loss factor if the quoted yield already includes system losses.
A more reliable estimate uses a location-specific modelling tool. The European Commission’s PVGIS service can estimate solar electricity production using geographical location, panel technology, installed capacity, roof slope, and orientation. An installer working to the relevant MCS standards should also assess shading and apply the appropriate methodology to estimate generation. The final figure is still a prediction because weather varies from year to year and real installations do not operate under perfectly repeatable conditions.
When you receive a quote, check that it states the following clearly: the proposed array capacity in kWp, estimated annual generation in kWh, roof orientation and tilt, shading assumptions, system-loss assumptions, inverter rating, and whether a battery is included. Ask whether the estimate is based on the actual roof or a generic regional average. If two quotes give very different output figures, ask both installers to explain their assumptions rather than choosing the higher number automatically.
You can also compare the estimate with your electricity bills and smart-meter data. Your annual consumption helps you understand how much solar generation could be used in the home, while half-hourly usage data can reveal whether demand happens during daylight hours. This information is particularly useful when deciding whether a battery is worthwhile. Generation estimates tell you what the system may produce; consumption data helps you understand what value that production may deliver.
Ways to Get More Electricity from Your Solar Panels
You cannot control the weather, but you can make sure the system is designed and operated sensibly. Start with a good site assessment. The installer should check roof orientation, tilt, shading, panel layout, cable routes, inverter sizing, and the condition of the roof. Choosing suitable, certified equipment and using a competent installer can reduce the risk of avoidable performance problems. A clear design should also explain how the system will be monitored and what to do if an inverter warning appears.
Keep panels reasonably clear of significant dirt and debris. In many locations, rainfall removes ordinary dust, but bird droppings, leaves, and stubborn deposits may remain. Do not climb onto a roof or use abrasive cleaning products to wash panels yourself. Follow the panel manufacturer’s maintenance instructions and use a qualified professional where cleaning or inspection involves working at height or near electrical equipment. Regularly check the monitoring app for unusual drops, inverter alerts, and long periods with no generation during daylight.
Try to match electricity use with solar production. Running a dishwasher or washing machine during a sunny part of the day can use energy that might otherwise be exported. If you have an EV, smart charging can help direct surplus generation to the vehicle, depending on the charger and tariff. Hot-water controls may also make use of excess electricity where the system is designed for that purpose. These changes are often simpler than buying additional equipment, although household convenience should remain part of the decision.
A battery may help if you regularly export a large amount of daytime electricity and import power later in the day. Before purchasing one, compare its installed cost, usable capacity, power rating, warranty, expected cycling, efficiency, and the difference between your import and export rates. Battery economics depend heavily on tariffs and usage patterns, so there is no single payback period that applies to everyone. A well-sized battery can improve self-consumption, but it does not increase the panels’ annual generation.
Finally, review performance over time rather than reacting to every short-term fluctuation. Compare monthly generation with the original estimate and account for seasonal weather. If the system suddenly stops producing, check the inverter display or app for an error message and contact the installer if the cause is not obvious. Do not open electrical equipment or disconnect live DC solar cables unless you are qualified and following the manufacturer’s safety procedure.
Frequently Asked Questions
1. How many kWh does a 4kW solar system produce per day in the UK?
A 4kW system generating 3,200 to 3,700kWh annually averages roughly 8.8 to 10.1kWh per day across the year. Actual daily production varies considerably. A clear summer day may produce well above that average, while a dark winter day may generate only a small amount. Location, roof direction, tilt, shade, and weather all affect the result.
2. Does a 4kW solar system generate enough electricity for a house?
It can cover a significant share of electricity use in many homes, but it will not necessarily supply all demand at every hour. The answer depends on annual consumption, daytime usage, electric heating, EV charging, and whether a battery is installed. A household may export surplus electricity during the day and still import power at night or in winter. Compare your annual usage and half-hourly demand with a location-specific generation estimate.
3. How much electricity does a 4kW solar system generate in winter?
Winter output is much lower than summer output because days are shorter and the sun is lower in the sky. In the illustrative monthly profile in this guide, December generation is around 80kWh and January around 90kWh, but actual systems can produce more or less. A south-facing, unshaded roof may perform better than a shaded or poorly oriented one. Use local modelling rather than treating these example figures as a guarantee.
4. Is a 4kW solar system worth it in the UK?
It can be worthwhile when the installation cost, generation estimate, household consumption, self-consumption, export payment, and expected equipment life make financial sense. The result varies by property and tariff, so a generic payback estimate is not reliable for every household. Request a quote that separates expected generation, electricity used at home, exported electricity, and assumed tariff rates. Compare more than one detailed proposal before making a decision.
5. Do solar panels work on cloudy days in the UK?
Yes. Solar panels can generate electricity from diffuse daylight, so they do not need direct sunshine to operate. Their output is usually lower under thick cloud than under clear skies, and very dark conditions can reduce generation substantially. This is why UK solar systems can produce electricity throughout the year, even though their output is much higher in summer.
Conclusion
A 4kW solar system in the UK can typically generate around 3,200–3,700kWh of electricity per year, although the actual result may be higher or lower depending on the property. A south-facing roof in a sunnier part of England can achieve a stronger yield, while a northern location, east- or west-facing roof, steep pitch, or shading may reduce annual generation. Monthly production is not evenly distributed: spring and summer usually deliver the largest share, while winter output is much lower.
The most useful figure is not a generic national average but a realistic estimate for your own roof. Check the proposed system size, annual kWh forecast, orientation, tilt, shading, and loss assumptions. Then compare that generation estimate with your household’s electricity use and the times when you need power. A battery and daytime appliance scheduling may help you use more of the electricity you generate, but they should be assessed against their costs and your actual usage pattern.
In short, a 4kW array can be a practical option for many UK homes, but the quality of the design and the match with household demand matter just as much as the headline capacity. Use a location-specific estimate, ask installers to explain their calculations, and treat any forecast as an informed prediction rather than a guaranteed output.
Sources and Further Reading
- Solar.org.uk – UK solar generation by region — location-specific PVGIS 5.3 modelled yields for 25 UK locations, roof pitches, and orientations.
- Solar.org.uk – Roof orientation and pitch — comparison of annual generation across roof directions and inclinations.
- Solar.org.uk – 4kW solar system cost and output — recent UK 4kWp system context and generation estimates.
- European Commission Joint Research Centre – PVGIS — public tool for estimating solar radiation and photovoltaic performance at a chosen location.
- MCS – Microgeneration Certification Scheme — UK certification scheme and standards information for small-scale renewable energy installations.


2 Comments