
How Many Units Does a Solar System Produce Per Month?
A solar system can produce anywhere from a few hundred to several thousand units of electricity per month, depending on its capacity, location, sunlight exposure, panel quality, and installation conditions. For homeowners considering solar energy, understanding this monthly production is essential because it helps determine whether a system can meet household electricity needs and reduce electricity bills.
In Pakistan, where sunlight is available throughout much of the year, solar panels can generate substantial amounts of electricity. For example, a properly installed 5kW solar system in Lahore may produce approximately 600 to 750 units per month on an annual average, while a 10kW system may generate around 1,200 to 1,250 units monthly. Actual production changes with the season, and some months will deliver considerably more electricity than others.
The important thing to remember is that a solar system’s advertised capacity does not tell you exactly how many units it will produce every month. A 5kW system does not generate 5,000 units monthly, just as a 10kW system does not automatically produce 10,000 units. System capacity measures the power the panels can produce under specified conditions, whereas monthly units measure the total electricity generated over time.
Let’s look at the numbers, the factors that influence solar production, and how you can estimate the right system size for your home.
Understanding Solar Electricity Production
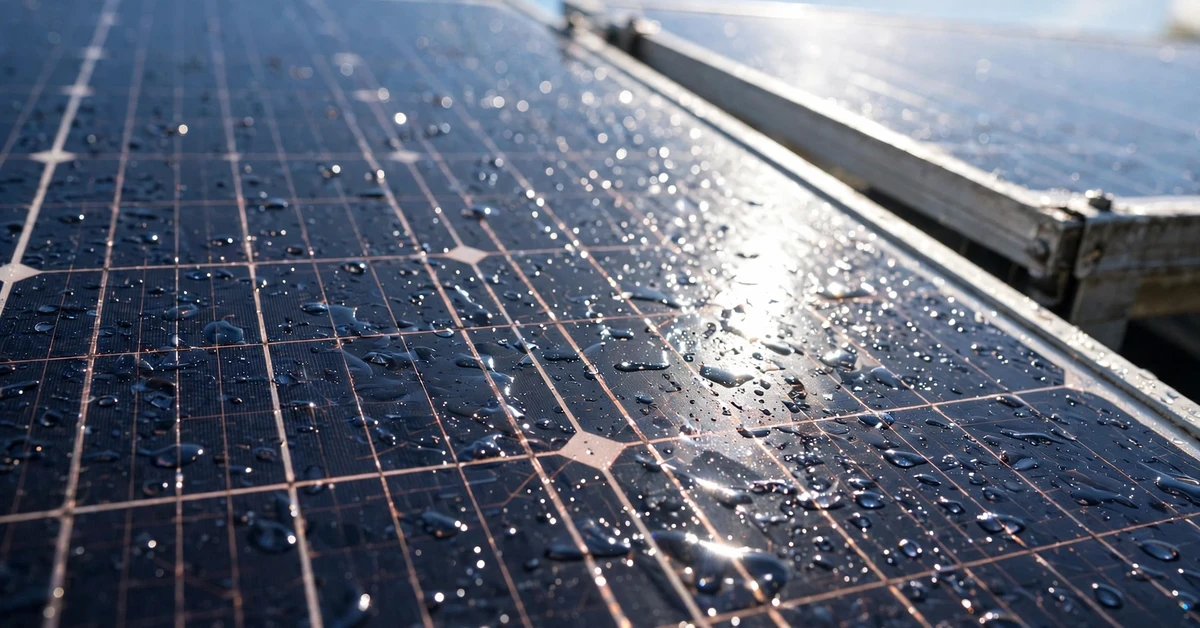
Solar panels convert sunlight into electricity using photovoltaic cells. When sunlight strikes these cells, they generate direct-current (DC) electricity, which an inverter converts into alternating-current (AC) electricity suitable for most household appliances. The amount generated depends on how much sunlight reaches the panels and how efficiently the complete system converts that sunlight into usable power.
Think of a solar system as a water pump. Its capacity tells you how much water it can pump at a particular moment under suitable conditions, while its total daily output depends on how long it operates and the conditions in which it works. Solar systems follow a similar principle: a larger system generally produces more electricity, but actual output changes throughout the day and across the year.
What Does One Unit of Electricity Mean?
In electricity billing, one unit equals one kilowatt-hour (kWh). It represents the amount of electrical energy consumed or generated when a 1,000-watt appliance operates for one hour.
For example, a 1,000-watt appliance running for five hours consumes five units of electricity. Similarly, a solar system that generates 25kWh of usable electricity in one day produces 25 units.
This distinction matters when calculating your home’s energy requirements. If your monthly electricity bill shows consumption of 500 units, you need a solar installation that can generate approximately 500kWh per month over the relevant period to match that consumption on an energy basis. However, matching monthly production does not necessarily eliminate your electricity bill because solar generation varies by time of day, household consumption may occur at night, and grid-export rules and charges can affect the final amount payable.
How Solar Panel Capacity Affects Monthly Units
Solar capacity is usually expressed in kilowatts (kW) or kilowatts-peak (kWp). A system’s capacity is generally the combined rated capacity of its solar panels, although the inverter’s AC rating can be different.
A larger panel array can collect more sunlight and generate more electricity when the installation conditions are similar. A 10kW system will generally generate about twice as much energy as a 5kW system under comparable conditions, but it will also require more suitable roof space and a correctly sized inverter.
Here is a simple illustration of how system capacity translates into possible monthly production in a sunny location such as Lahore.
| Solar system size | Approximate average units per month | Approximate units per year |
|---|---|---|
| 1kW | 120–125 | 1,400–1,500 |
| 3kW | 360–375 | 4,200–4,500 |
| 5kW | 600–625 | 7,000–7,500 |
| 8kW | 960–1,000 | 11,200–12,000 |
| 10kW | 1,200–1,250 | 14,000–15,000 |
| 15kW | 1,800–1,875 | 21,000–22,500 |
These are planning estimates based on approximately 1,400–1,500 units annually per kW of installed solar capacity. They are not guaranteed monthly outputs; seasonal conditions and installation losses can change the results.
The figures provide a useful starting point for estimating electricity production. For a more accurate forecast, use the exact location, panel orientation, shading conditions, inverter specifications, and local weather data rather than relying solely on system size.
Monthly Electricity Production by Solar System Size
Different homes require different amounts of electricity. A small household that mainly uses fans, lights, refrigerators, and televisions may need a smaller system than a property operating multiple air conditioners, electric water heaters, pumps, and other high-power appliances.
Understanding the typical output of different solar capacities helps you compare your options before investing.
How Many Units Does a 3kW Solar System Produce Per Month?
A 3kW solar system can produce approximately 360–375 units per month on an annual-average basis in Lahore under favorable installation conditions. In a location with better solar resources, the same system could generate more electricity, while a shaded or poorly oriented installation may produce less.
This capacity may suit a small home with moderate electricity consumption, especially where daytime appliances account for a significant portion of the total load. For example, a household using fans, LED lights, a refrigerator, a television, and a washing machine during daylight hours may benefit from a system of this size. However, adding an air conditioner or operating several high-power appliances simultaneously can increase electricity demand substantially.
Before choosing a 3kW system, review at least 12 months of electricity bills. Your average consumption provides a starting point, but your highest-consumption months deserve particular attention if you use air conditioning during summer. Also consider whether your goal is to reduce daytime grid consumption, cover most annual electricity usage, or maintain backup power during outages. Those goals may require different equipment configurations even when the total monthly energy requirement appears similar.
How Many Units Does a 5kW Solar System Produce Per Month?
A 5kW solar system can generate approximately 600–625 units per month on an annual-average basis in Lahore, based on a planning yield of around 1,440 units per kW annually. Some months can exceed this average, while winter conditions or persistent cloudy weather can reduce output.
For many medium-sized homes, a 5kW installation can provide a practical balance between generation capacity and roof space. It may support daytime operation of a refrigerator, fans, lighting, televisions, computers, washing machines, and selected air-conditioning loads, depending on their power requirements and operating hours.
Consider a family that consumes 600 units monthly. A 5kW system might generate roughly the same amount of electricity over an average month, but that does not mean the home will always be independent of the grid. If the panels generate excess electricity around midday and the family consumes most of its power after sunset, some of the daytime production may be exported rather than used directly. Batteries or an eligible grid-export arrangement can change how much of the solar energy benefits the household.
A professional assessment should also examine inverter capacity, the number and wattage of panels, roof orientation, and the family’s seasonal usage. These details help determine whether 5kW is a suitable size rather than simply a convenient number.
How Many Units Does a 10kW Solar System Produce Per Month?
A 10kW solar system may produce approximately 1,200–1,250 units per month on an annual-average basis in Lahore under suitable conditions. Its actual output will depend on the site’s solar resource, installation design, system losses, and weather.
This capacity may suit larger homes, small commercial properties, offices, and buildings with substantial daytime electricity consumption. It can support more simultaneous loads than a smaller system, provided the inverter and electrical installation are designed for those loads.
For example, a home with several air conditioners, refrigerators, computers, lighting circuits, and water pumps may need a larger solar array than a household with fewer appliances. Even so, a 10kW system should not be selected solely because the home has many rooms. The more useful question is how much electricity those appliances consume and when they operate.
High-power equipment can draw electricity faster than the panels generate it, particularly during cloudy weather or after sunset. A battery can store some daytime production for later use, but its usable capacity, charging power, and inverter rating all affect performance. If you are considering a 10kW installation, ask the installer for an estimated monthly production report and a clear explanation of expected daytime consumption, grid imports, and potential exports.
How Many Units Does a Solar System Produce in Pakistan?
Pakistan has substantial solar energy potential, but production differs across cities and seasons. A system installed in Lahore may produce a different annual total from an identical system in Karachi, Quetta, Islamabad, or a northern mountainous area.
A World Bank and ESMAP solar-resource assessment provides an example of this variation. Its reference figures for a fixed, open-space 1kW photovoltaic system show annual production of approximately 1,411kWh in Lahore, 1,501kWh in Islamabad, and 1,921kWh in Quetta. These figures are based on modeled reference installations, so they should not be treated as guaranteed output for a particular rooftop.
Estimated Monthly Production in Different Pakistani Cities
The following table illustrates how local conditions can affect the average monthly output of a 5kW system.
| City | Reference annual output per kW | Estimated 5kW annual output | Monthly annual average |
|---|---|---|---|
| Lahore | 1,411 units | 7,055 units | 588 units |
| Islamabad | 1,501 units | 7,505 units | 625 units |
| Quetta | 1,921 units | 9,605 units | 800 units |
Calculations use the annual yields reported in the cited World Bank/ESMAP assessment, multiplied by 5kW and divided by 12. Actual rooftop output can differ because of shading, tilt, temperature, dust, equipment, and other losses.
The differences demonstrate why local solar data matters. A system size that meets a particular household’s needs in one city may generate a different amount elsewhere. The best approach is to combine local production estimates with your own electricity-consumption history.
Average Sunlight and Seasonal Differences
Solar panels do not generate the same number of units every month. During longer, sunnier days, production may rise, while shorter days, cloud cover, fog, rain, and seasonal weather patterns can reduce output. The effect depends on the region and the installation.
In Lahore, for example, the cited reference dataset reports lower monthly output during winter than during spring. Its modeled 1kW system generates approximately 87kWh in January, compared with 140kWh in April. A 5kW array based on the same reference figures would therefore produce around 435 units in January and 700 units in April.
This seasonal variation is important for households that use air conditioners heavily in summer or electric heating in winter. A system that generates sufficient energy across the year may still require grid electricity during particular weeks or months. For a realistic financial estimate, evaluate month-by-month generation instead of assuming that every month will match the annual average.
Factors That Affect Monthly Solar Production
Two solar systems with identical panel capacities can produce different amounts of electricity. One might be installed on an open rooftop with excellent sunlight, while the other sits partly under trees or near buildings that cast shadows throughout the day. Even if both systems use quality equipment, their monthly production may differ noticeably.
Understanding the main factors affecting solar generation helps you make a better purchasing decision and identify problems if your system produces fewer units than expected.
Panel Efficiency, Orientation, and Shading
Solar panel efficiency describes how effectively a panel converts the sunlight it receives into electricity. Higher-efficiency panels can produce more power from a given roof area, although efficiency alone does not determine the total output of an entire system. Panel wattage, available sunlight, installation layout, and system losses also matter.
Orientation and tilt influence how much sunlight reaches the panels throughout the day and across different seasons. In Pakistan, panels are commonly oriented toward the south to capture strong sunlight, but the optimal arrangement depends on the location, roof structure, and whether the goal is to maximize annual generation or prioritize production at particular times. A qualified installer should evaluate the site rather than applying one angle to every roof.
Shading deserves special attention because even a relatively small obstruction can affect production. Nearby buildings, water tanks, satellite dishes, trees, and rooftop structures may cast shadows on individual panels. Depending on the electrical design, shading on one panel can also reduce the output of connected panels.
To avoid unnecessary losses, inspect the roof throughout the day before installation. If shading cannot be eliminated, ask whether suitable string arrangements, optimizers, or microinverters could improve performance. These solutions add design considerations and costs, so they should be selected according to the actual shading problem.
Weather, Dust, and Temperature
Sunlight is the main energy source for a photovoltaic system, which means cloudy weather can reduce production. Solar panels can still generate electricity under diffuse daylight, but their output generally falls when thick clouds block direct sunlight. Rain and fog can also influence generation, depending on their duration and intensity.
Dust is particularly relevant in areas where dry weather, construction activity, or airborne pollution leaves residue on rooftop panels. Accumulated dirt reduces the sunlight reaching the photovoltaic cells, potentially lowering the system’s output. Rain may wash away some dirt, but it does not always leave panels completely clean.
Another important factor is temperature. Although sunny weather helps solar generation, photovoltaic panels generally become less efficient as their operating temperature rises above their rated test conditions. Very hot summer afternoons can therefore produce less electricity than expected from sunlight levels alone. Good ventilation beneath the panels can help manage heat, while appropriate equipment selection and installation design can reduce avoidable losses.
Maintenance also plays a role. Check the inverter’s monitoring data regularly, look for unusual production drops, and arrange professional inspections when readings suggest a problem. If cleaning is necessary, follow the manufacturer’s recommendations and avoid working on a rooftop without suitable safety precautions. Never spray water onto hot panels or use abrasive cleaning materials that could damage their surfaces.
How to Calculate Monthly Solar Units
You do not need complicated engineering software to make an initial estimate of solar electricity production. A straightforward calculation can provide a useful starting point, as long as you understand that the result is an estimate rather than a guarantee.
The simplest method uses the system’s installed capacity and its expected annual energy yield per kilowatt. For a more detailed forecast, a solar calculator can account for local sunlight, panel orientation, tilt, and other system characteristics. The US National Renewable Energy Laboratory’s PVWatts calculator, for example, provides estimated monthly and annual electricity production based on the selected location and system assumptions.
The Simple Solar Production Formula
Use this formula to estimate average monthly electricity generation:
Monthly solar units = System capacity (kW) × Annual units per kW ÷ 12
For example, suppose you plan to install a 5kW solar system in Lahore and use an estimated annual yield of 1,411 units per kW from the cited reference dataset.
- System capacity: 5kW
- Estimated annual yield: 1,411 units per kW
- Estimated annual production: 5 × 1,411 = 7,055 units
- Estimated monthly average: 7,055 ÷ 12 = approximately 588 units
This calculation gives you a reasonable starting point for budgeting. It does not mean your system will produce precisely 588 units every month. Seasonal variation, weather, dirt, shading, and equipment performance will affect the actual result.
Calculate Production for Your Own Solar System
Use the following formula to estimate monthly and annual solar production. Adjust the system capacity and expected annual yield to reflect your installation location.
Average monthly units = System capacity (kW) × Annual yield per kW ÷ 12
Estimated annual units = System capacity (kW) × Annual yield per kW
For example, a 5kW system using an annual yield of 1,411 units per kW produces an estimated 7,055 units annually, or approximately 588 units per month on average. If you apply an additional loss allowance, reduce the estimate accordingly. Avoid counting losses twice if your annual-yield figure already includes them.
How to Estimate Solar Production More Accurately
For a more dependable estimate, use a location-based solar calculator and enter your planned system’s details. Include the panel capacity, approximate roof orientation, tilt, shading, and inverter configuration whenever the tool supports those inputs.
The PVWatts documentation explains that its monthly and annual outputs are estimates based on long-term typical weather data. Actual production in a particular month or year can differ from those estimates, so a forecast should be treated as a planning guide rather than a promise of guaranteed units.
It is also helpful to request a month-by-month production report from your installer. A report that shows expected winter and summer output is much more useful than a single annual number divided by 12, especially if your household has high seasonal electricity demand.
On-Grid vs. Hybrid vs. Off-Grid Solar Production
Solar system configuration affects how generated electricity is used, stored, and supplied to your appliances. An on-grid system, a hybrid system, and an off-grid system may have similar panel capacities, but they differ in battery arrangements, grid connections, and operating behavior.
One key distinction is that solar generation is not the same as electricity available to use at any moment. A system may produce plenty of energy over a sunny day yet still need the grid or stored battery power during the evening.
| System type | How it works | Main consideration |
|---|---|---|
| On-grid | Connected to the utility grid, usually without batteries | Excess generation may be exported where permitted; grid outages may shut down ordinary grid-tied inverters for safety |
| Hybrid | Can combine solar panels, batteries, and the utility grid | Backup depends on battery capacity, inverter capability, and supported circuits |
| Off-grid | Designed to operate independently of the utility grid | Requires suitable battery storage and enough generation for low-sunlight periods |
Why Battery Storage Does Not Increase Solar Generation
A battery stores electricity generated by the solar panels; it does not create additional solar energy. If your panels generate 25 units in a day, some can be used immediately, some can charge the battery, and some may be exported or lost through conversion and storage inefficiencies.
The benefit of a battery is that it can make solar electricity available later, including after sunset or during a grid outage. However, the amount available depends on the battery’s usable capacity, its charge level, power limits, and the efficiency of the complete system.
This distinction is particularly important when choosing equipment for a home that experiences frequent power interruptions. A battery system should be designed around the appliances you want to keep running and the expected duration of backup. Running several air conditioners for hours requires considerably more storage and power capability than operating a few lights, fans, and a router.
Do On-Grid Solar Systems Produce More Units?
An on-grid system does not automatically produce more electricity simply because it is connected to the grid. With the same panel array, sunlight exposure, and comparable equipment, its raw solar production may be similar to that of another properly designed system.
However, an on-grid installation without batteries can avoid some battery-related conversion and storage losses. A hybrid system’s actual output and usable energy depend on its equipment design and operating settings. Therefore, compare estimated panel generation separately from the amount of electricity your household can directly use, store, or export.
Before installation, check local utility connection requirements and the applicable rules for exporting surplus electricity. These policies can affect the financial value of your solar production even when the panels generate the same number of units.
How Many Solar Panels Do You Need for Your Home?
The number of panels depends on the system capacity and the wattage of each panel. Modern panels are available in different power ratings, so two installations with the same kilowatt capacity may use different numbers of modules.
A simple formula helps you estimate the quantity required:
Number of panels = Required system capacity in watts ÷ Individual panel wattage
For example, a 5kW system using 550-watt panels requires approximately 10 panels mathematically, because 5,000 divided by 550 equals about 9.1. In practice, you would generally use 10 panels to create a 5.5kW DC array, provided the inverter, electrical design, roof layout, and equipment specifications support that arrangement.
The following table gives approximate panel quantities for common system sizes using 550W panels.
| Target panel capacity | Approximate number of 550W panels | Actual DC capacity |
|---|---|---|
| 3kW | 6 | 3.3kW |
| 5kW | 10 | 5.5kW |
| 8kW | 15 | 8.25kW |
| 10kW | 19 | 10.45kW |
| 15kW | 28 | 15.4kW |
These examples round up to whole panels, so the installed capacity may be higher than the target. Always confirm that the inverter’s voltage, current, and input limits are compatible with the proposed array.
Roof space also matters. Panels need sufficient clearance, safe access, and an arrangement that minimizes shading. Roof structures, water tanks, stairwells, and neighboring buildings can reduce the usable area. A site survey can establish how many panels fit safely and whether the proposed capacity is realistic.
Choose System Size Based on Your Electricity Bill
Your electricity consumption is usually a better starting point than the size of your home. Review several months of bills, preferably covering a complete year, and calculate your average monthly usage as well as your seasonal peaks.
Suppose your household uses 600 units per month. That is an annual consumption of approximately 7,200 units. If your location and installation are expected to deliver 1,411 units per kW each year, the simple energy-matching calculation is:
7,200 ÷ 1,411 = approximately 5.1kW.
This suggests that around 5.1kW of panel capacity could match annual consumption under the assumed yield. It does not guarantee that every month’s generation will equal usage or that the bill will become zero. The final design should account for seasonal production, daytime versus nighttime demand, inverter sizing, export rules, roof constraints, and any future increase in electricity use.
How to Increase Monthly Solar Electricity Production
Getting the most out of your solar system requires more than purchasing high-wattage panels. The installation must capture sunlight effectively, convert it into usable electricity, and remain in good working condition throughout the year.
A few practical improvements can help maintain production and reduce avoidable losses.
Keep Solar Panels Clean and Properly Maintained
Dust, bird droppings, and other debris can reduce the sunlight reaching your panels. Inspect your system periodically and arrange cleaning when visible dirt or monitoring data suggests it is necessary. The appropriate cleaning frequency depends on local conditions, so a dusty area may require more attention than a location that receives regular rain.
Use the cleaning method recommended by the manufacturer. Avoid abrasive brushes, harsh chemicals, and unsafe rooftop access. If your panels are difficult to reach, a professional cleaning service is generally a safer choice.
Maintenance should also include checking inverter alerts, reviewing production trends, and having electrical connections inspected by a qualified technician when needed. A sudden drop in output may indicate shading, a faulty connection, inverter trouble, or another issue that cleaning alone will not solve.
Avoid Unnecessary Shading
Before installation, identify anything that might cast shadows over the panels during the day. Trees may grow over time, and nearby construction can change sunlight exposure. Water tanks, antennas, and rooftop structures should also be considered during system design.
If shading is unavoidable, discuss alternative panel layouts or suitable module-level power electronics with your installer. The best solution depends on how the panels are connected and how much of the array experiences shade.
Do not remove trees or modify rooftop structures without considering safety and other practical concerns. A proper shading assessment can help balance solar performance with the realities of your property.
Monitor Daily and Monthly Production
Most modern solar inverters provide monitoring through a display or mobile application. Check daily production occasionally, but pay particular attention to monthly totals because weather can make individual days unusually productive or unproductive.
Compare actual output with the expected production for that month, not with a fixed target that assumes every day receives identical sunlight. For example, a system may perform well during a sunny spring month but produce less during a cloudy winter period without having any technical fault.
If the decline is unusually large relative to local weather conditions, contact your installer. Monitoring data can help identify persistent performance problems before they continue for months.
Use Solar Electricity During Daylight Hours
If your household can shift some electricity consumption to daylight hours, you may use more of the electricity your panels generate directly. This can be particularly helpful for on-grid systems without batteries.
For example, where convenient and appropriate, you might operate a washing machine, run a water pump, or use other flexible appliances during periods of strong solar production. Air conditioners can also benefit from daytime solar generation when cooling is needed.
The amount of savings depends on your tariff, appliance consumption, system configuration, and local rules for exporting excess energy. Moving usage into daylight hours does not increase the panels’ physical output, but it can increase the proportion of generated electricity that your household uses directly.
Conclusion
So, how many units does a solar system produce per month? The answer depends mainly on installed capacity, location, sunlight exposure, system design, and seasonal conditions.
As a practical starting point, a 3kW system may generate around 360–375 units per month on an annual-average basis in a sunny location such as Lahore. A 5kW system may produce approximately 600–625 units, while a 10kW system may generate around 1,200–1,250 units under comparable assumptions. These figures are estimates, not guaranteed monthly totals, and actual results can differ substantially between seasons and installations.
If you are planning a solar installation, begin by checking your electricity bills and identifying when your household uses the most power. Then compare your requirements with location-specific solar production estimates and ask for a month-by-month forecast from a qualified installer.
The smartest solar investment is not necessarily the largest system you can afford. It is the system that fits your electricity needs, available roof space, budget, and preferred way of using or storing the energy it produces.
Frequently Asked Questions (FAQs)
1. How many units does a 5kW solar system produce per month in Pakistan?
A 5kW solar system in Lahore may generate approximately 600–625 units per month on an annual-average basis, using a planning yield of around 1,411–1,500 units per kW annually. Actual production varies by city, weather, shading, panel orientation, and system efficiency.
2. How many units does a 10kW solar system produce per day?
Using an annual yield of 1,411–1,500 units per kW, a 10kW system averages approximately 39–41 units per day over the year. Daily production can be higher in favorable weather and lower during cloudy periods or winter months.
3. Can a 5kW solar system run an entire house?
A 5kW system may cover much of a household’s electricity demand if its consumption and appliance usage fit the system’s production. However, running several air conditioners or other high-power appliances simultaneously may require additional grid electricity or suitable battery storage. The inverter’s power rating and system configuration also determine which loads can operate together.
4. Does a solar system produce the same number of units every month?
No. Monthly production changes with daylight hours, weather, temperature, shading, and panel cleanliness. Seasonal differences can be substantial, so annual production should not simply be treated as 12 identical monthly totals when planning your electricity supply.
5. How can I calculate the monthly units produced by my solar system?
Multiply the installed capacity in kilowatts by the expected annual electricity yield per kilowatt, then divide by 12. For example, a 5kW system with an estimated yield of 1,411 units per kW annually would generate approximately 588 units per month on average. A location-specific solar calculator can provide a more detailed monthly forecast.
Source: IRENA — International Renewable Energy Agency solar data



One Comment