What a Solar Charger Display Actually Shows
A solar charge controller display is the dashboard for your solar power system. It gives you a quick view of what the panels are producing, what the controller is doing with that energy, and how the battery is responding. Depending on the model, you may see PV voltage, PV current, PV power, battery voltage, charging current, temperature, daily energy, charge stage, load output, and warning codes. Not every controller displays every value, and manufacturers sometimes use different abbreviations or screen layouts, so the manual for your exact model remains the final reference. Still, once you understand the basic units and the path electricity takes through the system, most displays become much easier to interpret.
Think of the controller as a traffic manager between your solar panels and your battery. The panels generate electricity when light reaches them; the controller regulates that energy so the battery receives suitable charging voltage and current. The screen reports measurements at different points in that process. A PV value describes the solar-panel side, while a battery value describes the battery side. Those numbers are related, but they are not supposed to be identical in every system. An MPPT controller, for example, can convert higher panel voltage into a lower battery-charging voltage while increasing the available current on the battery side, subject to conversion losses and operating limits.
The most useful habit is to read several values together instead of judging the system from one number. A PV voltage reading by itself cannot tell you how much useful power the panels are delivering. Battery voltage by itself cannot reliably tell you the battery’s exact state of charge, especially while charging or under load. Look at voltage, current, power, charge stage, sunlight conditions, and the battery manufacturer’s specifications as a group. That approach gives you a more realistic picture and helps prevent unnecessary changes to controller settings.
PV Readings and Battery Readings
PV means photovoltaic, the technical term for converting light into electrical energy. PV readings are measurements on the solar-array input side of the controller. Battery readings describe the electrical conditions at the controller’s battery connection or, on some systems, at a remote battery monitor. These measurement points matter because a controller can receive one voltage from the panels and deliver a different voltage to the battery. On an MPPT system, that difference is part of normal operation rather than evidence of a fault.
A typical controller might cycle through screens labelled PV V, PV A, PV W, BAT V, BAT A, and BAT W. The letter V means volts, A means amperes (amps), and W means watts. Some displays also show kWh for energy accumulated over time, Ah for amp-hours, °C for temperature, and icons for charging or faults. Victron’s display documentation, for example, separates PV voltage, PV current, and PV power from battery voltage, battery charge current, and battery charge power. Renogy’s Voyager manual similarly lists PV array voltage, charging current, generated energy, battery voltage, and battery temperature among its display pages. Your controller may use different labels, but the underlying ideas are the same.
Common Units: V, A, W, and kWh
The letters on a solar display are shorthand for different electrical measurements, and mixing them up can lead to incorrect conclusions. Volts (V) describe electrical potential, amps (A) describe current, and watts (W) describe the rate of power transfer. Kilowatt-hours (kWh) measure energy accumulated over time; one kWh is 1,000 watts used or generated for one hour. Some systems also show amp-hours (Ah), which measure electric charge rather than energy, so Ah and kWh should not be treated as interchangeable. When you record readings, include the unit as well as the number: 14.2 V means something very different from 14.2 A or 14.2 kWh.
Understanding the Main PV Display Readings
The PV section tells you what the solar array is supplying to the controller at that moment. These readings naturally change through the day. Cloud cover, shade, panel angle, temperature, wiring, and the connected battery’s charging needs can all affect the numbers. A low reading early in the morning is not automatically a problem, just as a high voltage reading at midday does not guarantee high energy production. You need to consider the conditions when you check the screen.
PV Voltage (V)
PV voltage is the electrical potential measured at the solar input of the charge controller. It is often displayed as PV V or simply a number followed by V. The value depends on the panel configuration, sunlight, temperature, and the controller’s operating point. Panels connected in series add their voltages, while parallel connections increase available current while keeping the array voltage broadly similar to that of one panel. The exact operating voltage will move as conditions change, so a single fixed number should not be treated as the universal target for every installation.
It is important to distinguish operating voltage from open-circuit voltage, commonly written as Voc. Open-circuit voltage is measured when a panel or array is not connected to a load; operating voltage is measured while current is being drawn. The two are not interchangeable. In cold weather, panel Voc can rise, which is why the array’s maximum possible voltage must remain below the controller’s maximum PV input voltage under the conditions specified by the manufacturer. Exceeding that limit can damage equipment. Never add panels in series or change wiring based only on a display reading; check the panel datasheet, controller manual, and local electrical requirements first.
If PV voltage is zero or unusually low during bright daylight, investigate carefully. The controller may be switched off, a PV breaker or isolator may be open, a fuse may have failed, a connector may be loose, or shading may be severe. Some controllers also need to detect a suitable battery connection before they start operating. At night, zero PV current and little or no useful PV power are expected, although a controller may still display a voltage depending on its design and measurement method. Compare the reading with the controller’s manual and check wiring only after isolating the system safely.
PV Current (A)
PV current tells you how much current is flowing from the solar array into the controller. It is measured in amperes and may appear as PV A, solar current, or panel current. Current usually rises when stronger sunlight allows the panels to produce more power, but it is also affected by temperature, shade, the controller’s operating point, and the battery’s ability to accept a charge. A sudden drop in PV current under stable, strong sunlight can be a clue that something has changed, but clouds passing over the array can produce the same effect for a perfectly normal reason.
Do not confuse PV current with battery charging current. On an MPPT controller, the PV side may operate at a higher voltage and lower current than the battery side. The controller converts power from one voltage-current combination to another. For instance, an array delivering about 400 W at 40 V supplies roughly 10 A on the PV side. If the controller converts that power to a 14 V battery-charging level at 90% efficiency, the battery-side current could be around 25.7 A. This is an illustrative calculation, not a promised output: real values vary with conditions, limits, and losses. It explains why two current readings can differ without indicating a fault.
PV Power (W)
PV power is the rate at which the solar array is delivering electrical energy to the controller. It is measured in watts. When voltage and current are shown separately, a useful estimate is:
PV power (W) = PV voltage (V) × PV current (A)
If the display shows 36 V and 8 A, the estimated power is 288 W. The controller’s displayed PV power may differ slightly from a hand calculation because readings are rounded, sampled at different moments, or measured at different internal points. Some controllers show instantaneous power, while others also provide daily energy in kWh. Instantaneous watts tell you what is happening now; kilowatt-hours tell you how much energy has accumulated over a period.
A panel’s advertised wattage is usually a laboratory-rated maximum under standard test conditions. Real-world output is often lower because sunlight intensity, panel temperature, orientation, dust, shade, and wiring losses differ from test conditions. A 400 W array will not necessarily show 400 W every sunny afternoon. To judge performance fairly, compare readings under similar sunlight and temperature conditions, and look at daily energy over several days. If production is consistently much lower than expected, inspect shading, dirt, connections, panel condition, and controller sizing.
Why PV Readings Change During the Day
Solar output is not a fixed stream. Morning and evening sunlight reaches panels at a lower angle, clouds can reduce irradiance in seconds, and partial shade from trees, buildings, or nearby equipment can affect one panel or even one cell group. Panel temperature also matters: many modules produce less voltage as their cells become hotter, even on a bright day. For this reason, compare performance at similar times and under similar weather rather than expecting the display to show the same peak every day. A short-lived dip during passing cloud is usually different from a persistent reduction that remains after the sky clears.
Understanding Battery Display Readings
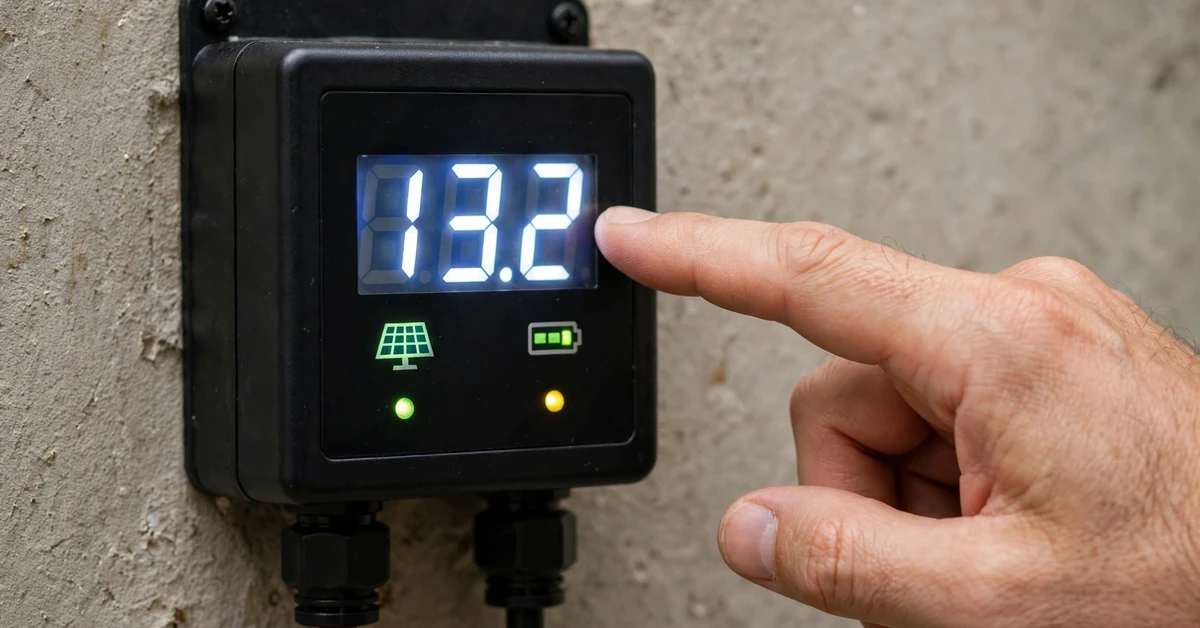
The battery section helps you understand whether energy is reaching the storage system and what the charging process is doing. It is especially important because battery chemistry changes the meaning of voltage readings. Lead-acid, AGM, gel, and lithium batteries have different charging requirements and voltage behaviour. Even batteries within the same broad category can have manufacturer-specific settings. Use the battery datasheet for recommended absorption voltage, float voltage, charge-current limits, temperature limits, and any required communications or protection settings.
Battery Voltage
Battery voltage is the electrical potential measured at the controller’s battery terminals or another monitoring point. It is commonly shown as BAT V or Battery V. The number changes as the battery charges, discharges, rests, and supplies loads. During charging, the controller may raise battery voltage toward a programmed absorption target. When a load starts, voltage may dip; when the load stops, it may recover. These movements are normal to a degree, so a quick glance is not enough to diagnose battery health.
A nominal 12 V battery is not expected to sit at exactly 12.0 V at all times. Its voltage depends on chemistry, state of charge, temperature, recent charging or discharging, and current flow. The same principle applies to 24 V and 48 V battery banks. A voltage reading taken while the battery is being charged should not be interpreted using a resting-voltage chart without accounting for the charging state. For a more meaningful state-of-charge estimate, follow the battery manufacturer’s procedure. Some lithium systems provide more dependable state-of-charge information through a battery management system (BMS) or shunt-based monitor rather than voltage alone.
If battery voltage appears too high, stop and verify the system settings against the battery specification. Incorrect battery type selection, an unsuitable charging profile, a faulty temperature sensor, or a wiring/measurement issue may be involved. If voltage is too low, the battery may be deeply discharged, a load may be drawing more power than the panels can replace, or a connection may be poor. Do not increase charge voltage simply to make the display look better. Incorrect settings can shorten battery life or create a safety hazard, particularly with lithium batteries that require a compatible charging profile and BMS protection.
Charging Current and Battery Power
Battery charging current is the current flowing from the controller into the battery. It may be labelled BAT A, Charge A, or Charging Current. Positive current commonly indicates charging, although display conventions vary. Some systems can show negative battery current when the battery is supplying loads. Confirm the sign convention in your controller or monitor manual before interpreting a minus sign as an error.
Battery charging power is the rate at which electrical power is being delivered to the battery. A simple estimate is battery voltage multiplied by battery current. For example, 14.2 V multiplied by 20 A is about 284 W. This figure can be lower than PV power because conversion is not perfectly efficient, and it can also be limited by the controller, battery, wiring, temperature, or programmed charge-current ceiling. If the controller shows high PV power but low battery current, check whether the battery is already near full, whether a charging limit is active, and whether loads are consuming energy at the same time.
Why Battery Chemistry Matters
Battery chemistry changes both the charging targets and the way voltage behaves during use. Lead-acid batteries generally need a staged charging profile and may require temperature compensation, while lithium batteries often rely on a battery management system to supervise cell voltage and temperature. A lithium battery’s voltage curve can remain relatively flat across much of its usable capacity, which makes voltage-only state-of-charge estimates especially unreliable. Even within one chemistry, the manufacturer may specify particular limits for charging current, absorption duration, low-temperature charging, and standby voltage. Set the controller to the exact battery profile recommended for the installed battery rather than choosing a profile based only on nominal voltage.
Bulk, Absorption, and Float Charging Stages
Many solar charge controllers use a multi-stage charging process. The names and exact behaviour depend on the battery chemistry and the manufacturer’s algorithm, but bulk, absorption, and float are common labels for lead-acid charging profiles. The display’s stage indicator can explain why current changes even when sunlight remains steady. A falling current is not always a sign that the panels have stopped working; it may mean the battery is moving through its normal charging cycle.
Bulk is generally the high-current stage. The controller supplies as much suitable current as it can, within its limits, while battery voltage rises toward the absorption target. Absorption holds voltage around a set point while charging current gradually tapers as the battery accepts less current. Float uses a lower maintenance voltage to help keep a fully charged battery topped up. Victron’s monitoring documentation describes these stages in this general way: bulk supplies charge current, absorption operates at a preset voltage, and float maintains the charged battery. The time spent in each stage depends on the controller algorithm, battery type, settings, and operating conditions.
A controller showing Float during strong sunshine is not necessarily wasting solar power or malfunctioning. The battery may already be full, and the controller may reduce charging to avoid overcharging it. Solar energy can still supply connected loads, depending on the system design and how the controller or inverter manages power. Likewise, a controller showing Bulk late in the day is not automatically faulty if the battery is low or daytime production has been limited. Look at the complete pattern: battery voltage, current, stage, solar power, and energy history.
Lithium batteries require special care. Many lithium iron phosphate (LiFePO4) batteries do not use the same float or equalization approach as conventional lead-acid batteries. Some manufacturers specify no float charging or a particular standby voltage, while others define a tailored profile. Never assume that every battery should be charged using generic 12 V lead-acid settings. Select the correct battery profile, confirm any BMS communication requirements, and follow the battery maker’s instructions.
MPPT vs. PWM: Why Their Readings Differ
MPPT stands for maximum power point tracking. An MPPT controller continually adjusts its input operating point to extract useful power from the solar array, then converts that power to the voltage needed by the battery. This is why PV voltage and battery voltage can be noticeably different. The PV side may show a higher voltage while the battery side shows a lower voltage and a higher current. The controller cannot create energy, so output power is slightly lower than input power because of conversion losses.
PWM means pulse-width modulation. A PWM controller regulates charging by rapidly connecting and disconnecting the panel from the battery under its charging control strategy. In many common systems, the panel is effectively pulled closer to battery voltage during charging, so the panel’s available higher-voltage operating point is not used in the same way as with MPPT. As a result, PV and battery voltage readings may look closer together than they do on an MPPT system. The suitability of either controller depends on array configuration, battery voltage, cost, environmental conditions, and manufacturer limits.
| Feature | MPPT controller | PWM controller |
|---|---|---|
| Operating approach | Tracks the array’s maximum power point and converts voltage | Regulates panel-to-battery connection using pulse-width control |
| PV and battery voltage | Can differ substantially | Often closer during charging |
| Current readings | PV current and battery current can be quite different | Readings are often more closely related |
| Typical use | Useful where array voltage is higher than battery voltage and conversion benefits matter | Often used in simpler, appropriately matched systems |
| Key check | Confirm PV input voltage and current limits | Confirm panel voltage compatibility and controller ratings |
The display should always be interpreted according to the controller type. A PV voltage that is much higher than battery voltage can be normal for MPPT. A similar-looking voltage on a PWM system may also be normal. Neither pattern alone proves that one controller is working better. Compare the actual energy delivered to the battery over similar days, while accounting for panel size, shade, temperature, and system design.
How to Read a Solar Charger Display Step by Step
Start by identifying the controller make and model. Find the manual and check what each screen measures, where the measurement is taken, and whether the controller uses an MPPT or PWM design. This small step prevents a lot of confusion because abbreviations and display sequences vary. Some products automatically rotate through screens, while others require you to press an up, down, or select button. A few provide readings through a phone app rather than a built-in LCD.
Next, check the display during daylight when the panels are receiving useful sunlight. Record PV voltage, PV current, PV power, battery voltage, battery charging current, and charge stage if those values are available. Note the weather, approximate time, and whether any large loads are running. Recheck later under similar conditions. A single measurement is a snapshot; several measurements reveal a pattern. If the controller provides daily yield, record that too, because accumulated energy is often more useful for evaluating performance than a momentary wattage figure.
Then compare the battery readings with the battery manufacturer’s charging specifications. Confirm the selected battery profile, absorption voltage, float behaviour, temperature compensation where applicable, and maximum charging current. Do not change settings simply because a number looks unfamiliar. If the controller is connected to a BMS, verify that the battery and controller are communicating as intended. Remote monitoring equipment may report a slightly different voltage from the controller because of cable drop or different measurement locations.
Finally, inspect the system safely if the readings remain unusual. Look for shade, dirt, damaged cables, loose connectors, tripped breakers, blown fuses, or signs of overheating. Do not disconnect live PV connectors under load or open electrical equipment unless you are qualified and following the manufacturer’s shutdown procedure. Solar panels can produce hazardous DC voltage whenever illuminated. If you find damaged insulation, burnt components, water ingress, or repeated overvoltage warnings, stop using the affected equipment and contact a qualified solar technician.
Normal Readings, Warning Signs, and Troubleshooting
There is no single universal “normal” PV voltage, battery voltage, or charging current. A correct reading depends on the panel string design, controller rating, battery chemistry, nominal system voltage, sunlight, temperature, and current charging stage. Use the ranges and limits printed in the equipment manuals rather than copying values from another installation. Online examples can help explain concepts, but they cannot replace the specifications for your actual components.
| Display symptom | Possible explanation | What to check |
|---|---|---|
| PV voltage is zero in daylight | Open isolator, disconnected array, blown fuse, wiring fault, or controller state | Check status indicators and approved isolation points |
| PV voltage is present but PV current is near zero | Weak sunlight, open circuit, shading, battery full, or charging not enabled | Check sunlight, array connections, and controller status |
| PV power is lower than expected | Shade, dirt, heat, poor orientation, cable losses, or undersized array | Compare conditions and inspect the array safely |
| Battery voltage rises but charge current falls | Battery approaching absorption/float, current limit, or reduced solar input | Check charge stage and battery settings |
| Battery voltage is unexpectedly high | Wrong battery profile, sensor issue, or charging fault | Verify settings and stop if above battery limits |
| Battery voltage is low | Heavy load, insufficient solar harvest, discharged battery, or poor connection | Review loads, daily yield, and wiring |
| Error or warning code appears | Model-specific protection or equipment fault | Record the code and consult the exact manual |
If the screen is blank, first check whether the controller has power from the battery or another required source. Some controllers do not start from PV alone, and others have a minimum battery-voltage requirement. Check the manual before attempting a reset. If the display is lit but values are frozen or inconsistent, a communications issue, sensor problem, firmware condition, or internal fault may be responsible. Record the model, firmware version if available, and exact warning message before contacting support.
A controller may also limit output because it has reached its rated current, temperature limit, or programmed charging ceiling. This can happen even when the panels could theoretically produce more power. The battery itself may also limit charging, especially when a BMS reduces or stops current because of temperature, cell voltage, or protection conditions. In these cases, the controller may be behaving correctly by respecting a limit. Review the controller’s status information and the battery’s own monitoring data before assuming that the solar panels are defective.
Daily energy history is a particularly useful troubleshooting tool. If today’s yield is lower than yesterday’s, compare weather and shading before concluding that equipment has failed. If output has fallen steadily across many clear days, inspect the panels for dirt, new shade, damage, and loose connections. A sudden change after electrical work may point toward a wiring or configuration issue. Keep a simple log of daily kWh, peak PV watts, battery voltage, and notable weather conditions. Over time, that record can reveal problems that are difficult to spot from one screen.
Understanding Icons and Error Codes
Small symbols can communicate important status information even when the numerical readings look normal. A sun or panel icon may indicate PV input, a battery symbol may show charging progress, and a lightning bolt or arrow may indicate power flow, but the meaning is model-specific. Flashing icons can represent active charging, an alarm, a protection event, or simply a screen animation. If a code such as Err, E01, or a numbered warning appears, write down the exact characters and consult the troubleshooting section for that controller model. Do not assume that an error code has the same meaning across brands; the same number can represent different conditions on different products.
Frequently Asked Questions
1. What does PV mean on a solar charge controller?
PV stands for photovoltaic, which refers to the process of converting sunlight into electricity. On a solar charge controller, PV readings usually describe the solar array’s input voltage, current, and power. These values show what the panels are supplying to the controller, not necessarily what is reaching the battery. The battery-side values are displayed separately on many controllers.
2. Why is my PV voltage higher than my battery voltage?
This is common with an MPPT controller. It can operate the solar array at a higher voltage and convert the available power to a lower battery-charging voltage. Because power is approximately voltage multiplied by current, the battery-side current may be higher than the PV-side current after conversion, allowing for losses. Check your controller’s manual to confirm the expected behaviour for your model.
3. Why does my solar charger show voltage but no amps?
Voltage can be present even when little or no current is flowing. Possible reasons include weak sunlight, heavy shading, an open circuit, a disconnected battery, a controller that is not enabled, or a battery that is already charged and accepting very little current. Check the charge stage, weather, wiring status, and controller warnings. If the condition persists in strong sunlight, have the system inspected safely.
4. What should my battery voltage read while charging?
The correct charging voltage depends on battery chemistry, nominal system voltage, temperature, and the manufacturer’s charging profile. A 12 V lead-acid battery and a 12 V LiFePO4 battery do not use identical charging settings. Voltage also changes between bulk, absorption, and float stages. Use the battery datasheet and controller configuration rather than relying on one generic voltage target.
5. Is it normal for solar charging current to drop when the battery is nearly full?
Yes, it can be completely normal. During absorption, the controller maintains a target voltage while the battery gradually accepts less current. Once the controller moves to float or the battery’s management system limits charging, current may fall further. If current drops unexpectedly while the battery is low and sunlight is strong, investigate shading, controller limits, wiring, and warning messages.
Conclusion
Understanding solar charger display readings is much easier when you separate the PV side from the battery side. PV voltage, current, and power describe what the solar array supplies to the controller, while battery voltage, charging current, and battery power show what is happening at the storage side. Bulk, absorption, and float indicators explain the controller’s charging stage, and daily energy history helps you judge performance over time. The numbers will move as sunlight, temperature, loads, and battery conditions change, so do not treat every fluctuation as a fault.
The most reliable approach is to learn the labels used by your specific controller, compare readings with the manuals for your panels and battery, and look for patterns rather than isolated numbers. Remember that MPPT and PWM controllers behave differently, and battery chemistry determines the correct charging profile. Never exceed equipment voltage or current limits, and do not work on live solar wiring unless you are qualified. With a little practice, your controller’s screen becomes a useful diagnostic tool rather than a confusing collection of abbreviations.